Peel-the-Onion
Introduction to Peel the Onion
The article, Solution Development started with the questions: “Have you ever had such a clever idea that you couldn't imagine it would not be a success? Then, for whatever the reason, it just didn't develop as you thought it would - maybe not at all?” The article went on to posit the notion that the interplay between the concept and the context in which it develops is a major determinant in whether an idea evolves to becomes a valuable solution in the eyes of those who take delivery.
The transition from concept to commercialization occurs in stages with each one posing its own set of challenges. In many respects the innovator is on a quest in a well-crafted video game wherein the difficulty increases level by level. Just as some players don’t complete the quest despite repeated tries, some ideas just don’t see the light of day as solutions. One way to bypass the frustration associated with figuring out a particularly tough level in a game is to use a cheat sheet. The same holds true in the overcoming the hurdles in the path of solution development. The article, then, is an innovator’s cheat sheet.
The key to advance an idea is to ask and respond to questions. This process can be problematic. First, what question or set of questions should one ask given the current stage of development in which the idea finds itself? And second, what if one doesn’t hear or heed the response? Oftentimes innovators become so taken with their ideas at the outset that they start basking in the glory of anticipated success before there is cause to do so. Who needs to ask questions? They already know their ideas will work. Far worse, though, is to ask how one’s baby looks only to hear back from others that they find it quite ugly. In this situation, innovators may lie to themselves and say that others didn’t REALLY dislike it that much or they just won’t ask any more. So, if you’re an innovator who is willing to ask tough questions, receive less than complimentary feedback, and respond with resolve to keep moving forward, read on.
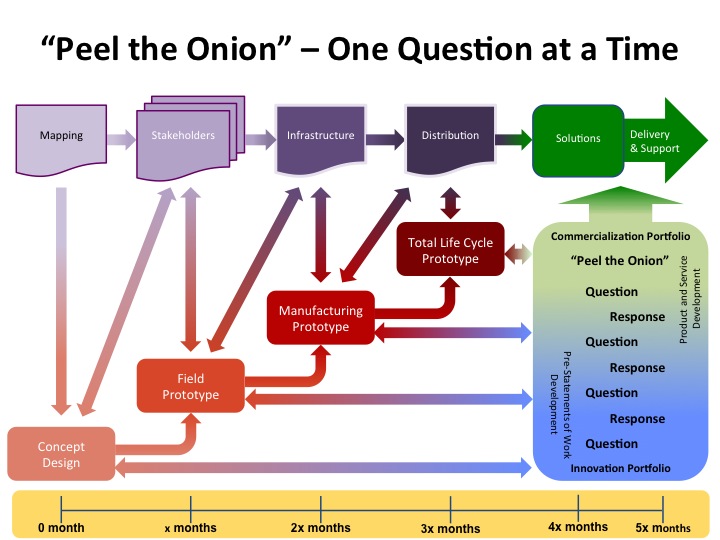
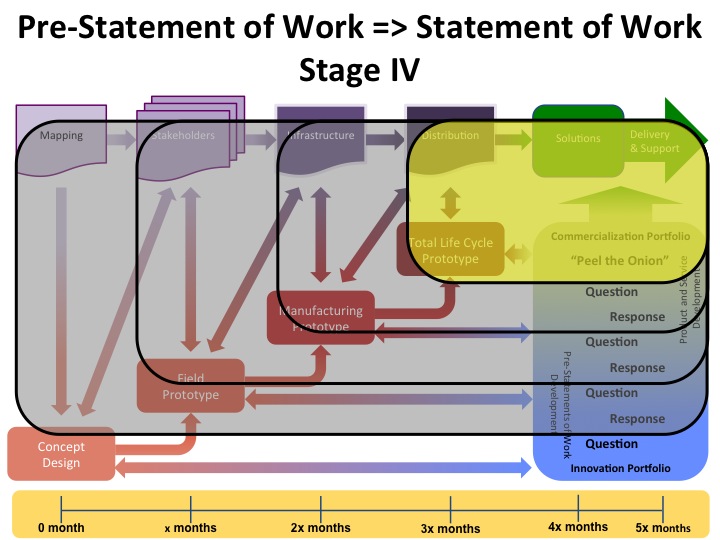
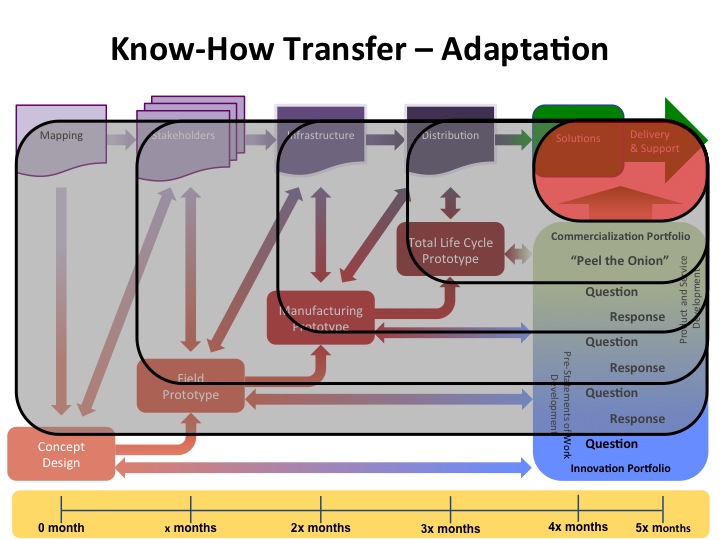
Figure 1 below offers a framework introduced in the Solutions Development article. Now, though, the block on the right shows a progression of preliminary statements of work that lead from one question and response dyad to another, stage by stage, through product and service development and on to commercialization.
In many respects this step by step approach is summarized by the longstanding riddle, “How does one eat an elephant?” The answer, of course, is “One bite at a time!” Or one could consider discovering the path for an idea to become a solution as an onion which gets peeled one layer at a time in order to better absorb what one has learned thus far before going deeper, asking the next question, and taking the next step.
Peel the Onion-Stage 1
Each stage in the journey of an idea / concept through the "Innovation Portfolio" to the "Commercialization Portfolio" begins with a publicly presented pre-Statement of Work (pre-SoW) that poses key questions for consideration, notes why they are important, and outlines who will take what steps by when in order to address them. As the pre-SoW attracts collaborators, sponsors, and investors, they negotiate a formal statement of work that specifies the terms and conditions by which team members listed in the pre-SoW will exercise their roles and responsibilities to provide expected deliverables on schedule and within cost in exchange for compensation.
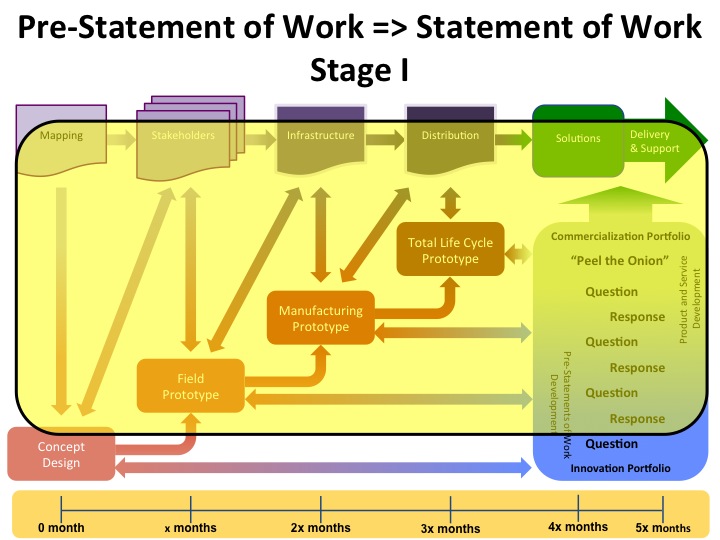
Returning to the analogy of a video game, Figure 2 below represents the onset of a quest whereupon the lead player has a role as innovator with a singular mission: convert an idea / concept into a viable solution for delivery to a market. The lay of the land represented by the yellow block may provide a generalized overview, but the initial conditions, cast of characters, and changing circumstances make the journey challenging despite previous experience and familiarity with the process.
As in the quest, the innovator needs a "map" upon which to note current position, evaluate progress, clarify roles and relationships with others one meets along the way, and identify resources required to continue. Accordingly, the first pre-SoW an innovator should consider would be for a map of the context in which the idea / concept will develop into a marketable solution. Such a map would relate to the geographic area where this development will occur and in so doing identify landmarks in terms of capital be they land, facilities, equipment, and infrastructure; potential customers, value / supply chain partners, collaborators, competitors, and advocates; and the systems, processes, and tools that enables them to function effectively as a cohesive whole.
Several preliminary statements of work associated with the iAGRI Innovation Portfolio focus different aspects of mapping. For instance, the following introductory section from a recently submitted pre-SoW states the purpose of mapping - in particular, digital mapping - and why it’s important overall especially, in the context of Sokoine University of Agriculture:
- Pre-SoW - Mapping of Sokoine University of Agriculture Campus
- A map is an essential tool in navigation and guiding land or physical infrastructure development. Printed paper maps have been a mainstay in physical infrastructure development and land-use planning for Sokoine University of Agriculture (SUA) since its inception. However, these maps are prone to damage due to the poor storage conditions and their access is generally restricted; often leading to their eventual loss. There is need to rescue such invaluable map data and enhance their access, distribution and utility for posterity. Advancements in Geographic Information Systems (GIS) and increased data connectivity have hastened the process of digital map production, storage and sharing. Establishment of digital maps of SUA campuses in a web-enabled GIS framework will facilitate data access for near real-time physical planning and servicing of utilities and navigation on the university campuses to all stakeholders.
While the digital mapping example at SUA applies geography, mapping can also document activities along a value / supply chain or within operations and decision-making processes. The example below captures the approach as proposed in a first phase pre-SoW for data visualization:
- Pre-SoW - Data Visualization for Harvest, Dryer, Storage Coordination - Phase 1
- For most companies providing products and services to agricultural markets, it is important to understand what commercial application there may be for data visualization and decision modeling. Several such companies are tightly integrated in harvest logistics with both harvesting products as well as grain storage and drying products. This integration is a differentiator that may allow them to leapfrog competition and offer first to market data optimization products for harvest logistics--a distinct a competitive advantage.
- We propose a multi-phase approach to better understand commercial opportunities for data visualization. Phase 1 will concentrate on process mapping several large farm growers and warehouse co-operatives to understand decision points and decision actions in the harvest logistics process. Phase 1 will also identify high-level concepts for decisions to model with data visualization. Subsequent phases will validate and refine Phase 1 concepts. The overall goal of this project is to identify and present concepts that best meet the strategic goals of select companies serving agricultural markets. Specific goals to be targeted through the ideation of Phase 1 include the following:
- Optimization - farm equipment continues to operate in the field with minimal downtime while tuned for best performance.
- Logistics - real-time information about performance, location, and current status for farm equipment drives the coordinated deployment of each machine and maximized operation of the overall system
- Connectivity - producers stay connected to trusted value chain partners each step of the crop cycle and draw upon common data with robust, integrated applications to improve production throughout the growing and harvesting phases.
These two examples illustrate how mapping can identify the type, location, application, and flows associated with various forms of capital. Clearly, the pre-SoW about mapping SUA’s campus relates to natural, built, and financial capital whereas the pre-SoW about data visualization goes further to tap into human and social capital, as well. This full dimensionality about capital is an important consideration when determining the potential for value creation and value exchange within an innovative and adaptive ecosystem. But before continuing, a note about capital...
Oftentimes, when one uses the term, "capital", it refers to money. While money is certainly a form of capital, there are other types that are equally important, if not more so depending on circumstances. Classification of capital can become quite extensive as in the description, Capital, by Guillaume Lebleu on P2P Foundation. For the purposes of this article, there are five forms of capital - human (individual), social (interactive), manufactured (produced or built), natural, and financial (multiple mediums of exchange).
Capital in all its forms, then, is essential to an adaptive ecosystem. As such, it plays a dual role. First, capital provides the incentive for whomever has it to invest it. Then, capital is the means by which a successful investment gets acknowledged and rewarded. One gives and one gets back more. The bottom line: innovators need to understand and apply the dynamics of capital within the complete landscape of an ecosystem to advance their ideas / concepts.
Because of the critical relationship between the idea and the ecosystem in which it will become a solution, training about how to do process mapping would be quite useful. To that point, the following example pulls from the background / purpose of work in a recently submitted pre-SoW which speaks to the potential value such training may provide:
- Pre-SoW - The Art of Process Mapping - Education and Training
- Process Mapping is a proficiency that is proving to be of increased value. As innovative system solutions are being required to solve challenges facing a growing population, the ability to define an operation by all of the tasks that compose that operation, then identify creative opportunities for process bottlenecks and pain points is a highly sought talent. There are certain techniques and methods that constitute successful process mapping assignments. Knowing how to facilitate and participate in a well-managed process mapping session will enhance the chances for success when mapping a process. This will increase the opportunity to ideate truly breakthrough innovations.
Time to start your quest. Make a map. It will illustrate the evolutionary source-sink dynamics within natural and constructed ecosystems that hold sufficient wealth of resources, flows, and interconnections for you, the innovator, to bring your idea / concept to fruition as a valuable solution.
